Logging for ML Model Deployments
In previous blog posts we introduced the decorator pattern for ML model deployments and then showed how to use the pattern to build extensions for an ML model deployment. For example, in this blog post we did data enrichment using a PostgreSQL database. The extensions were added without having to modify the machine learning model code at all, we were able to do it by using the decorator pattern. In this blog post we’ll add logging to a model deployment without having to modify the model code, using a decorator.
This blog post is written in a Jupyter notebook and we'll be switching between Python code and shell commands, the formatting will reflect this.
Introduction
As software systems become more and more complex, the people that build and operate these systems are finding that they are very hard to debug and inspect. To be able to solve this issue, a software system needs to be observable. An observable system is a system that allows an outside observer to infer the internal state of the system based purely on the data that it generates. The quality of "observability" helps the operators of a system to understand the inner workings of the system and to solve issues that may come up, even when the issues may be unprecedented.
Observability is a non-functional requirement (NFR) of a system. An NFR is a requirement that is placed on the operation of a system that has nothing to do with the specific functions of the system. Rather, it is a cross-cutting concern that needs to be addressed within the whole system design. Logging is a way that we can implement observability in a software system.
In the world of software systems, a "log" is a record of events that happen as software runs. A log is made up of individual records called log records that each represent a single event in the software system. Logs are useful for debugging the system, keeping a permanent record of its activities, and many other purposes. In general, log records are designed for debugging, alerting, and auditing the activities of the system.
Just like any other software component, machine learning models need to create a log of events that may be useful later on. For example, we may want to know how many predictions the model made, how many errors occurred, and any other interesting events that we may want to keep track of. In this blog post we'll create a decorator that creates a log for a machine learning model.
This post is not meant to be a full guide for doing logging in Python, but we'll include some background information to make it easier to understand. Logging in Python can get complicated and there are other places that cover it more thoroughly. Here is a good place to learn more about Python logging.
All of the code is available in this github repository.
Software Architecture
The logging decorator will operate within the model service, but it requires outside services to handle the logs that it produces. This makes the software architecture more complicated and requires that we add several more services to the mix.
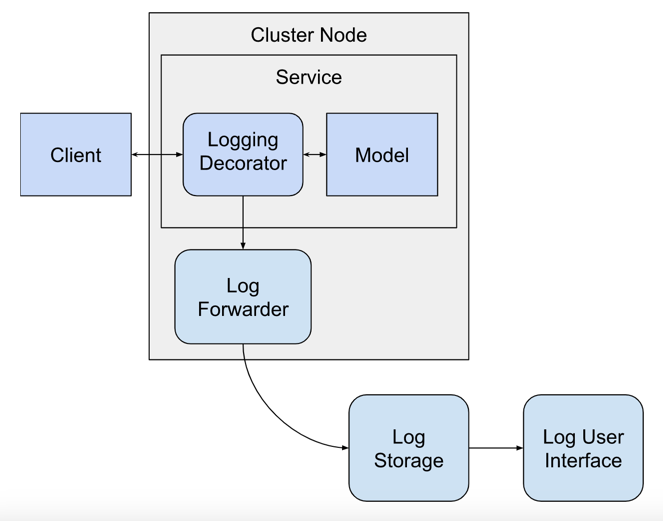
The logging decorator is executing right after the prediction request is received from the client and a prediction is made by the model, it will send logs to be handled by other services. The other services are:
- Log Forwarder: a service that runs on each cluster node that forwards logs from the local hard drive to the log aggregator service.
- Log Storage: a service that can store logs and also query them.
- Log User Interface: a service with a web interface that provides access to the logs stored in the log storage service.
The specific services that we'll use will be detailed later in the blog post.
Logging Best Practices
There are certain things that we can do when we create a log for our application that makes it more useful, especially in production settings. For example, attaching a "level" to each log record makes it easy to filter the log according to the severity of the events. For example, a log record is of level "INFO" when it communicates a simple action that the system has taken. A "WARNING" log event is an event that may indicate a problem in the system, but the system can continue to run. A good description of the common log levels is here.
Another good practice for logs is to include contextual information that can help to debug any problems that may arise in the execution of the code. For example, we can include the location in the codebase where the log record was generated. This information is very helpful during debugging and helps to quickly find the code that caused the event to happen. The information is often presented as the function name, code file name, and line number where the log record was generated. Another piece of useful contextual information is the hostname of the machine where the log was generated.
Logs should be easy to interpret for both humans and machines, this means that log records are often written in text strings. Humans can easily read text, but parsing a text string is complicated for machines. To allow both humans and machines to easily parse a log message, a good middle ground is to use JSON formatting. JSON-formatted logs are easy to parse, but also allow a human to quickly read and understand a log message.
Unique identifiers are useful to include in logs because they allow us to correlate many different log records together into a cohesive picture. For example, a correlation id is a unique ID that is generated to identify a specific transaction or query in a system. Adding unique identifiers to each log record can make it possible to debug complex problems that happen across system boundaries. A good description of correlation ids is here.
Logging in Python
The python standard library has a module that can simplify logging. The logging module is imported and used like this:
import logging

logger = logging.getLogger()

logger.warning("Warning message.")
Warning message.
To start logging, we instantiated a logger object using the logging.getLogger() function. Then we used the logger object to log a WARNING message.
The log records are being sent to the stderr output of the process by default. We'll change that by instantiating a StreamHandler and pointing it at the stdout stream:
import sys

stream_handler = logging.StreamHandler(sys.stdout)

logger.addHandler(stream_handler)
logger.warning("Warning message.")
Warning message.
We just replaced the original log handler that logged messages to stderror with another one that logs to stdout. A log handler is a software component that is able to send log messages to destinations outside of the running process.
We can also log messages at other levels, here is a WARNING and DEBUG message:
logger.warning("Warning message.")
logger.debug("Debug message.")
Warning message.
When the code above executed, only the WARNING message was printed because the logger only sends log messages to the output that are at the WARNING level or above by default. This filtering functionality is helpful when you are only interested in logs above a certain level. We can change that by configuring the logger:
logger.setLevel(logging.DEBUG)

logger.warning("Warning message.")
logger.debug("Debug message.")
Warning message.
Debug message.
Now we can see the debug message.
We can put in more information to the log record by adding a formatter to the log handler:
formatter = logging.Formatter('%(asctime)s:%(name)s:%(levelname)s: %(message)s')
stream_handler.setFormatter(formatter)

logger.warning("Warning message.")
logger.debug("Debug message.")
2023-04-23 21:28:47,875:root:WARNING: Warning message.
2023-04-23 21:28:47,876:root:DEBUG: Debug message.
A formatter is a software component that can format log messages according to a desired format. The log record now contains the date and time of the event, the name of the logger that generated the message, the level of the log, and the log message. These are all standard fields that are attached to log messages when they are created, more information about these fields can be found in the Python documentation here.
Each logger has a name attached to it when it is created, the name of the current logger is "root" because we created the logger without specifying a name. We can create a new logger with a name like this:
logger = logging.getLogger("test_logger")

logger.debug("Debug message.")
2023-04-23 21:28:47,881:test_logger:DEBUG: Debug message.
The log record has the name of the logger, which is not the root logger that we were using before.
Logging Environment Variables
To log extra information that is not available by default within each log record we have to extend the logging module by creating Filter classes. A Filter is simply a class that filters log records and can also modify them. This information will come from the environment variables of the process in which the logger is running.
To do this we'll create a Filter that is able to pick up information from the environment variables and add it to each log record.
import os
from typing import List
from logging import Filter


class EnvironmentInfoFilter(Filter):
    """Logging filter that adds information to log records from environment variables."""

    def __init__(self, env_variables: List[str]):
        super().__init__()
        self._env_variables = env_variables

    def filter(self, record):
        for env_variable in self._env_variables:
            record.__setattr__(env_variable.lower(), os.environ.get(env_variable, "N/A"))
        return True
To try it out we'll have to add an environment variable that will be logged:
os.environ["NODE_IP"] = "198.197.196.195"
Next, we'll instantiate the Filter class and add it to a logger instance to see how it works.
environment_info_filter = EnvironmentInfoFilter(env_variables=["NODE_IP"])

logger.addFilter(environment_info_filter)
formatter = logging.Formatter('%(asctime)s : %(name)s : %(levelname)s : %(node_ip)s : %(message)s')
stream_handler.setFormatter(formatter)

logger.warning("Warning message.")
logger.debug("Debug message.")
2023-04-23 21:28:47,910 : test_logger : WARNING : 198.197.196.195 : Warning message.
2023-04-23 21:28:47,911 : test_logger : DEBUG : 198.197.196.195 : Debug message.
The log record now contains the IP address that we set in the environment variables.
Logging in JSON
So far, the logs we've been generated have been in a slightly structured format that we came up with. It uses colons to separate out different sections of the log record. If we want to easily parse the logs to extract information from them, we should instead use JSON records. In this section we'll use the python-json-logger package to format the log records as JSON strings.
First, we'll install the package:
from IPython.display import clear_output

!pip install python-json-logger

clear_output()
We'll instantiate a JsonFormatter object that will convert the logs to JSON:
from pythonjsonlogger import jsonlogger


json_formatter = jsonlogger.JsonFormatter("%(asctime)s %(name)s %(levelname)s %(node_ip)s %(message)s")
We'll add the formatter to the stream handler that we created above like this:
stream_handler.setFormatter(json_formatter)
Now when we log, the output will be a JSON string:
logger.error("Error message.")
{"asctime": "2023-04-23 21:28:50,037", "name": "test_logger", "levelname": "ERROR", "node_ip": "198.197.196.195", "message": "Error message."}
We can add easily add more fields from the log record to make it more comprehensive:
json_formatter = jsonlogger.JsonFormatter("%(asctime)s %(node_ip)s %(process)s %(thread)s %(pathname)s %(lineno)s %(levelname)s %(message)s")

stream_handler.setFormatter(json_formatter)

logger.error("Error message.")
{"asctime": "2023-04-23 21:28:50,047", "node_ip": "198.197.196.195", "process": 793, "thread": 140704422703936, "pathname": "/var/folders/vb/ym0r3p412kg598rdky_lb5_w0000gn/T/ipykernel_793/2505421541.py", "lineno": 5, "levelname": "ERROR", "message": "Error message."}
Some of these fields were added by the Filter that we built above, other fields are default fields provided by the Python logging module.
The JSON formatter can also add extra fields and values to the log record by using the "extra" parameter:
extra = {
    "action": "predict",
    "model_qualified_name": "model_qualified_name",
    "model_version": "model_version",
    "status":"error",
    "error_info": "error_info"
}

logger.error("message", extra=extra)
{"asctime": "2023-04-23 21:28:50,057", "node_ip": "198.197.196.195", "process": 793, "thread": 140704422703936, "pathname": "/var/folders/vb/ym0r3p412kg598rdky_lb5_w0000gn/T/ipykernel_793/1433050719.py", "lineno": 9, "levelname": "ERROR", "message": "message", "action": "predict", "model_qualified_name": "model_qualified_name", "model_version": "model_version", "status": "error", "error_info": "error_info"}
The extra fields are:
- action: the method called on the MLModel instance
- model_qualified_name: the qualified name of the model
- model_version: the version of the model
- status: whether the action succeeded or not, can be "success" or "error"
- error_info: extra error information, only present if an error occurred
This information would normally be included in the "message" field of the log record as unstructured text, but by breaking it out and putting it into individual fields in the JSON log record we'll be able to parse it later.
Putting It All Together
We've done a few things with the logger module, now we need to put it all together into one configuration that we can use to set up the logger the way we want it.
The logging.config.dictConfig() function can accept all of the options of the loggers, formatters, handlers, and filters and set them up with one function call.
import logging.config


logging_config = {
    "version": 1,
    "disable_existing_loggers": True,
    "loggers": {
        "root": {
            "level": "INFO",
            "handlers": ["stdout"],
            "propagate": False
        }
    },
    "filters": {
        "environment_info_filter": {
            "()": "__main__.EnvironmentInfoFilter",
            "env_variables": ["NODE_IP"]
        }
    },
    "formatters": {
        "json_formatter": {
            "class": "pythonjsonlogger.jsonlogger.JsonFormatter",
            "format": "%(asctime)s %(node_ip)s %(name)s %(pathname)s %(lineno)s %(levelname)s %(message)s"
        }
    },
    "handlers": {
        "stdout":{
            "level":"INFO",
            "class":"logging.StreamHandler",
            "stream": "ext://sys.stdout",
            "formatter": "json_formatter",
            "filters": ["environment_info_filter"]
        }
    }
}

logging.config.dictConfig(logging_config)
logger = logging.getLogger()

logger.debug("Debug message.")
logger.info("Info message.")
logger.error("Error message.")
{"asctime": "2023-04-23 21:28:50,074", "node_ip": "198.197.196.195", "name": "root", "pathname": "/var/folders/vb/ym0r3p412kg598rdky_lb5_w0000gn/T/ipykernel_793/4067465749.py", "lineno": 4, "levelname": "INFO", "message": "Info message."}
{"asctime": "2023-04-23 21:28:50,076", "node_ip": "198.197.196.195", "name": "root", "pathname": "/var/folders/vb/ym0r3p412kg598rdky_lb5_w0000gn/T/ipykernel_793/4067465749.py", "lineno": 5, "levelname": "ERROR", "message": "Error message."}
The logger behaved in the same way as when we created it programmatically.
Installing a Model
We won't be training an ML model from scratch in this blog post because it would take a lot of space in the post. We'll be reusing a model that we built in a previous blog post. The model's code is hosted in this github repository. The model is used to predict credit risk.
The model itself can be installed as a normal Python package, using the pip command:
!pip install -e git+https://github.com/schmidtbri/health-checks-for-ml-model-deployments#egg=credit_risk_model

clear_output()
Making a prediction with the model is done through the CreditRiskModel class, which we'll import like this:
from credit_risk_model.prediction.model import CreditRiskModel
Now we'll instantiate the model class in order to make a prediction.
model = CreditRiskModel()

clear_output()
In order to make a prediction with the model instance, we'll need to instantiate the input:
from credit_risk_model.prediction.schemas import CreditRiskModelInput, EmploymentLength, HomeOwnership, \
    LoanPurpose, LoanPurpose, Term, VerificationStatus

model_input = CreditRiskModelInput(
    annual_income=273000,
    collections_in_last_12_months=20,
    delinquencies_in_last_2_years=39,
    debt_to_income_ratio=42.64,
    employment_length=EmploymentLength.less_than_1_year,
    home_ownership=HomeOwnership.MORTGAGE,
    number_of_delinquent_accounts=6,
    interest_rate=28.99,
    last_payment_amount=36475.59,
    loan_amount=35000,
    derogatory_public_record_count=86,
    loan_purpose=LoanPurpose.debt_consolidation,
    revolving_line_utilization_rate=892.3,
    term=Term.thirty_six_months,
    total_payments_to_date=57777.58,
    verification_status=VerificationStatus.source_verified
)
The model's input schema is called CreditRiskModelInput and it holds all of the features required by the model to make a prediction.
Now we can make a prediction with the model by calling the predict() method with an instance of the CreditRiskModelInput class.
prediction = model.predict(model_input)

prediction
CreditRiskModelOutput(credit_risk=<CreditRisk.safe: 'safe'>)
The model predicts that the client's risk is safe.
The output is also provided as an object, and because the model is a classification model, the output is an Enum. We can view the schema of the model output by requesting the JSON schema from the object:
model.output_schema.schema()
{'title': 'CreditRiskModelOutput',
 'description': 'Credit risk model output schema.',
 'type': 'object',
 'properties': {'credit_risk': {'description': 'Whether or not the loan is risky.',
   'allOf': [{'$ref': '#/definitions/CreditRisk'}]}},
 'required': ['credit_risk'],
 'definitions': {'CreditRisk': {'title': 'CreditRisk',
   'description': 'Indicates if loan is risky.',
   'enum': ['safe', 'risky'],
   'type': 'string'}}}
The two possible outputs of the model are "safe" and "risky".
Creating the Logging Decorator
As you saw above, the model did not produce any logs. To be able to emit some logs about the model's activity, we'll create a Decorator that will do logging around an MLModel instance.
In order to build a MLModel decorator class, we'll need to inherit from the MLModelDecorator class and add some functionality.
from typing import List, Optional
import logging
from ml_base.decorator import MLModelDecorator
from ml_base.ml_model import MLModelSchemaValidationException


class LoggingDecorator(MLModelDecorator):
    """Decorator to do logging around an MLModel instance."""

    def __init__(self, input_fields: Optional[List[str]] = None,
                 output_fields: Optional[List[str]] = None) -> None:
        super().__init__(input_fields=input_fields, output_fields=output_fields)
        self.__dict__["_logger"] = None

    def predict(self, data):
        if self.__dict__["_logger"] is None:
            self.__dict__["_logger"] = logging.getLogger("{}_{}".format(
                self._model.qualified_name, "logger"))

        # extra fields to be added to the log record
        extra = {
            "action": "predict",
            "model_qualified_name": self._model.qualified_name,
            "model_version": self._model.version
        }

        # adding model input fields to the extra fields to be logged
        new_extra = dict(extra)
        if self._configuration["input_fields"] is not None:
            for input_field in self._configuration["input_fields"]:
                new_extra[input_field] = getattr(data, input_field)

        self.__dict__["_logger"].info("Prediction requested.", extra=new_extra)

        try:
            prediction = self._model.predict(data=data)
            extra["status"] = "success"

            # adding model output fields to the extra fields to be logged
            new_extra = dict(extra)
            if self._configuration["output_fields"] is not None:
                for output_field in self._configuration["output_fields"]:
                    new_extra[output_field] = getattr(prediction, output_field)
            self.__dict__["_logger"].info("Prediction created.", extra=new_extra)
            return prediction
        except Exception as e:
            extra["status"] = "error"
            extra["error_info"] = str(e)
            self.__dict__["_logger"].error("Prediction exception.", extra=extra)
            raise e
The LoggingDecorator class has most of its logic in the predict() method. This method simply instantiates a logger object and logs a message before a prediction is made, after it is made, and in the case when an exception is raised. Notice that the exception information is logged, but the exception is re-raised immediately after. We don't want to keep the exception from being handled by whatever code is using the model, we just need to emit a log of the event.
The decorator also adds a few fields to the log message:
- action: the action that the model is performing, in this case "prediction"
- model_qualified_name: the qualified name of the model performing the action
- model_version: the version of the model performing the action
- status: the result of the action, can be either "success" or "error"
- error_info: an optional field that adds error information when an exception is raised
These fields are added on top of all the regular fields that the logging package provides. The extra information should allow us to easily filter logs later.
Decorating the Model
To test out the decorator we’ll first instantiate the model object that we want to use with the decorator.
model = CreditRiskModel()

clear_output()
Next, we’ll instantiate the decorator:
logging_decorator = LoggingDecorator()
We can add the model instance to the decorator after it’s been instantiated like this:
decorated_model = logging_decorator.set_model(model)
We can see the decorator and the model objects by printing the reference to the decorator:
decorated_model
LoggingDecorator(CreditRiskModel)
The decorator object is printing out its own type along with the type of the model that it is decorating.
Now we can try out the logging decorator by making a prediction:
prediction = decorated_model.predict(model_input)

prediction
{"asctime": "2023-04-23 21:28:57,431", "node_ip": "198.197.196.195", "name": "credit_risk_model_logger", "pathname": "/var/folders/vb/ym0r3p412kg598rdky_lb5_w0000gn/T/ipykernel_793/3804123212.py", "lineno": 33, "levelname": "INFO", "message": "Prediction requested.", "action": "predict", "model_qualified_name": "credit_risk_model", "model_version": "0.1.0"}
{"asctime": "2023-04-23 21:28:57,452", "node_ip": "198.197.196.195", "name": "credit_risk_model_logger", "pathname": "/var/folders/vb/ym0r3p412kg598rdky_lb5_w0000gn/T/ipykernel_793/3804123212.py", "lineno": 44, "levelname": "INFO", "message": "Prediction created.", "action": "predict", "model_qualified_name": "credit_risk_model", "model_version": "0.1.0", "status": "success"}


CreditRiskModelOutput(credit_risk=<CreditRisk.safe: 'safe'>)
Calling the predict() method on the decorated model now emits two log messages. The first message is a "Prediction requested." message and happens before the model's predict method is called. The second is a "Prediction created." message and happens after the prediction is returned by the model to the decorator. The decorator can also log exceptions made by the model.
The logging decorator is also able to grab fields from the model's input and output and log those alongside the other fields. Here is how to configure the logging decorator to do this:
logging_decorator = LoggingDecorator(input_fields=["collections_in_last_12_months", "debt_to_income_ratio"],
                                     output_fields=["credit_risk"])

decorated_model = logging_decorator.set_model(model)

prediction = decorated_model.predict(model_input)

prediction
{"asctime": "2023-04-23 21:28:57,461", "node_ip": "198.197.196.195", "name": "credit_risk_model_logger", "pathname": "/var/folders/vb/ym0r3p412kg598rdky_lb5_w0000gn/T/ipykernel_793/3804123212.py", "lineno": 33, "levelname": "INFO", "message": "Prediction requested.", "action": "predict", "model_qualified_name": "credit_risk_model", "model_version": "0.1.0", "collections_in_last_12_months": 20, "debt_to_income_ratio": 42.64}
{"asctime": "2023-04-23 21:28:57,480", "node_ip": "198.197.196.195", "name": "credit_risk_model_logger", "pathname": "/var/folders/vb/ym0r3p412kg598rdky_lb5_w0000gn/T/ipykernel_793/3804123212.py", "lineno": 44, "levelname": "INFO", "message": "Prediction created.", "action": "predict", "model_qualified_name": "credit_risk_model", "model_version": "0.1.0", "status": "success", "credit_risk": "safe"}


CreditRiskModelOutput(credit_risk=<CreditRisk.safe: 'safe'>)
The "Prediction requested." log message now has two extra fields, the "collections_in_last_12_months" field and the "debt_to_income_ratio" field which were directly copied from the model input. The "Prediction created." log message also has the "credit_risk" field, which is the prediction returned by the model.
We now have a working logging decorator that can help us to do logging if the model does not do logging for itself.
Adding the Decorator to a Deployed Model
Now that we have a decorator that works locally, we can deploy it with a model inside of a service. The rest_model_service package is able to host ML models and create a RESTful API for each individual model. We don't need to write any code to do this because the service can decorate the models that it hosts with decorators that we provide. You can learn more about the package in this blog post. You can learn how the rest_model_service package can be configured to add decorators to a model in this blog post.
To install the service package, execute this command:
!pip install rest_model_service>=0.3.0

clear_output()
The configuration for our model and decorator looks like this:
service_title: Credit Risk Model Service
models:
  - class_path: credit_risk_model.prediction.model.CreditRiskModel
    create_endpoint: true
    decorators:
      - class_path: ml_model_logging.logging_decorator.LoggingDecorator
        configuration:
          input_fields: ["collections_in_last_12_months", "debt_to_income_ratio"]
          output_fields: ["credit_risk"]
logging:
    version: 1
    disable_existing_loggers: false
    formatters:
      json_formatter:
        class: pythonjsonlogger.jsonlogger.JsonFormatter
        format: "%(asctime)s %(node_ip)s %(name)s %(levelname)s %(message)s"
    filters:
      environment_info_filter:
        "()": ml_model_logging.filters.EnvironmentInfoFilter
        env_variables:
        - NODE_IP
    handlers:
      stdout:
        level: INFO
        class: logging.StreamHandler
        stream: ext://sys.stdout
        formatter: json_formatter
        filters:
        - environment_info_filter
    loggers:
      root:
        level: INFO
        handlers:
        - stdout
        propagate: true
The two main sections in the file are the "models" section and the "logging" section. The models section is simpler and lists the CreditRiskModel, along with the LoggingDecorator. The decorators configuration simply adds an instance of the LoggingDecorator to the CreditRiskModel when the service starts up.
The logging configuration is set up exactly like we set it up in the examples above except that it is in YAML format. The YAML is converted to a dictionary and passed directly into the logging.config.dictConfig() function.
To run the service locally, execute these commands:
export NODE_IP=123.123.123.123
export PYTHONPATH=./
export REST_CONFIG=./configuration/rest_configuration.yaml
uvicorn rest_model_service.main:app --reload
The NODE_IP environment variable is set so that the value can be added to the log messages through the filter we built above. The service should come up and can be accessed in a web browser at http://127.0.0.1:8000. When you access that URL you will be redirected to the documentation page that is generated by the FastAPI package:
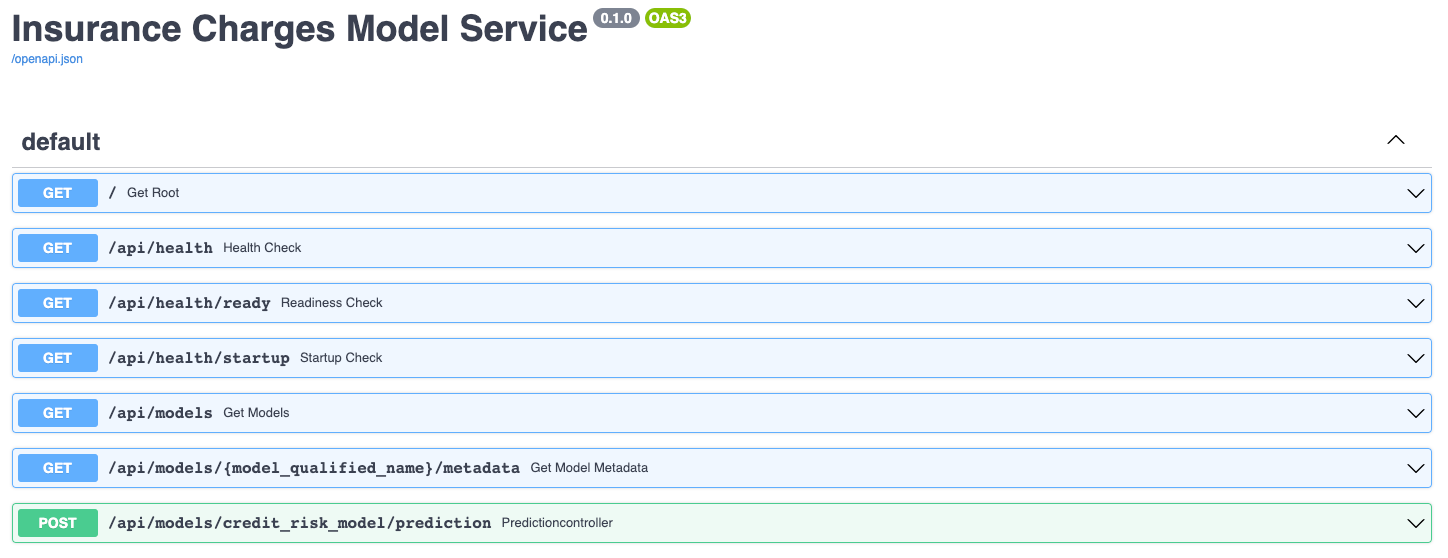
The documentation allows you to make requests against the API in order to try it out. Here's a prediction request against the insurance charges model:
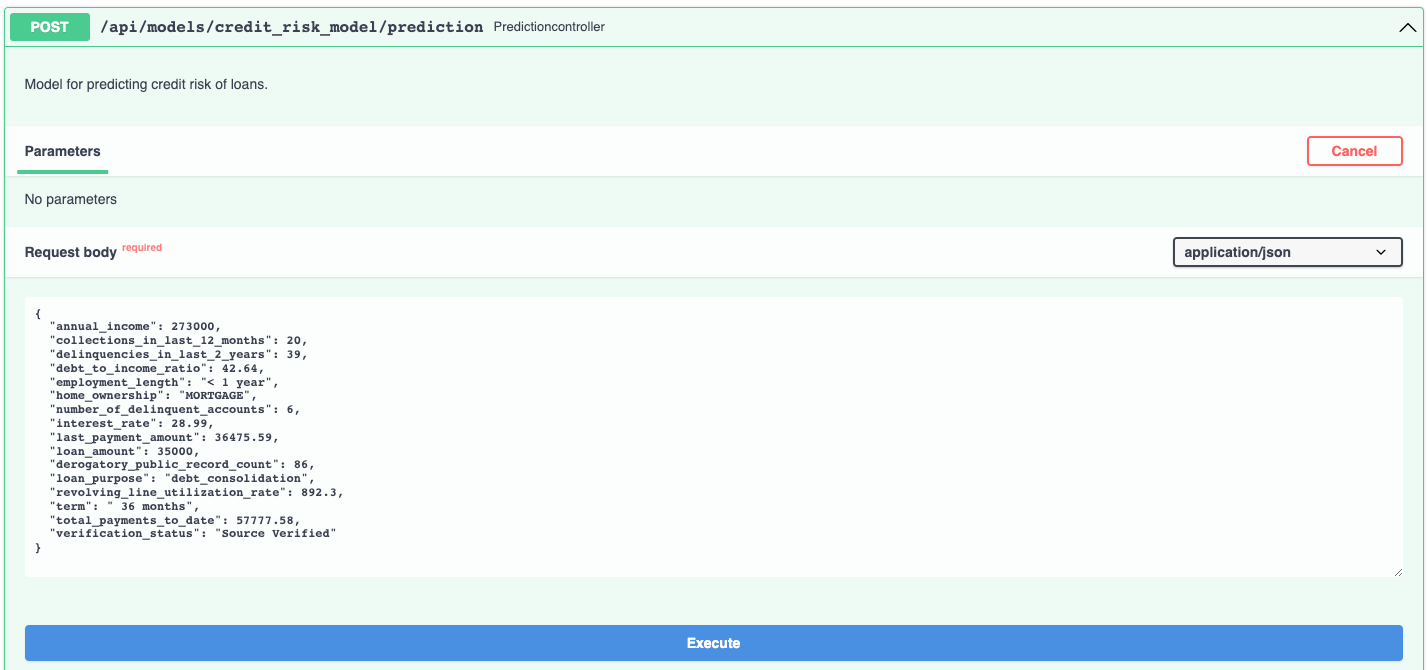
And the prediction result:
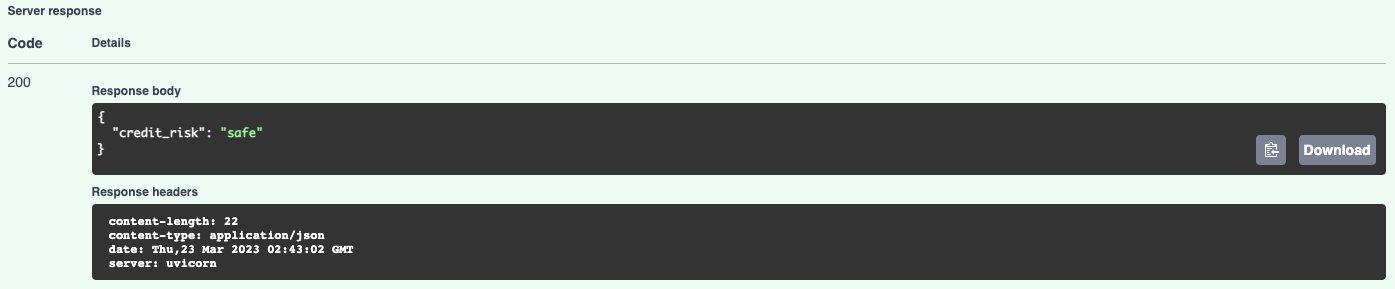
The prediction made by the model had to go through the logging decorator that we configured into the service, so we got these two log records from the process:
The local web service process emits the logs to stdout just as we configured it.
Deploying the Model Service
Now that we have a working service that is running locally, we can work on deploying it to Kubernetes.
Creating a Docker Image
Kubernetes needs to have a Docker image in order to deploy something, we'll build an image using this Dockerfile:
# syntax=docker/dockerfile:1
FROM python:3.9-slim as base

WORKDIR /dependencies

# installing git because we need to install the model package from the github repository
RUN apt-get update -y && \
    apt-get install -y --no-install-recommends git

# creating and activating a virtual environment
ENV VIRTUAL_ENV=/opt/venv
RUN python3 -m venv $VIRTUAL_ENV
ENV PATH="$VIRTUAL_ENV/bin:$PATH"

# installing dependencies
COPY ./service_requirements.txt ./service_requirements.txt
RUN pip install --no-cache -r service_requirements.txt

FROM base as runtime

ARG DATE_CREATED
ARG REVISION
ARG VERSION

LABEL org.opencontainers.image.title="Logging for ML Models"
LABEL org.opencontainers.image.description="Logging for machine learning models."
LABEL org.opencontainers.image.created=$DATE_CREATED
LABEL org.opencontainers.image.authors="6666331+schmidtbri@users.noreply.github.com"
LABEL org.opencontainers.image.source="https://github.com/schmidtbri/logging-for-ml-models"
LABEL org.opencontainers.image.version=$VERSION
LABEL org.opencontainers.image.revision=$REVISION
LABEL org.opencontainers.image.licenses="MIT License"
LABEL org.opencontainers.image.base.name="python:3.9-slim"

WORKDIR /service

# install packages
RUN apt-get update -y && \
    apt-get install -y --no-install-recommends libgomp1 && \
    apt-get clean && \
    rm -rf /var/lib/apt/lists/*

COPY --from=base /opt/venv ./venv

COPY ./ml_model_logging ./ml_model_logging
COPY ./LICENSE ./LICENSE

ENV PATH /service/venv/bin:$PATH
ENV PYTHONPATH="${PYTHONPATH}:/service"

CMD ["uvicorn", "rest_model_service.main:app", "--host", "0.0.0.0", "--port", "8000"]
The Dockerfile includes a set of labels from the Open Containers annotations specification. Most of the labels are hardcoded in the Dockerfile, but there are three that we need to add from the outside: the date created, the version, and the revision. To do this we'll pull some information into environment variables:
DATE_CREATED=!date +"%Y-%m-%d %T"
REVISION=!git rev-parse HEAD

!echo "$DATE_CREATED"
!echo "$REVISION"
['2023-04-23 21:30:31']
['88a78deb3ed38e5bff5f0633fa4a4bf6202b868f']
Now we can use the values to build the image. We'll also provide the version as a build argument.
!docker build \
  --build-arg DATE_CREATED="$DATE_CREATED" \
  --build-arg VERSION="0.1.0" \
  --build-arg REVISION="$REVISION" \
  -t credit_risk_model_service:0.1.0 ..\

clear_output()
To find the image we just built, we'll search through the local docker images:
!docker images | grep credit_risk_model_service
credit_risk_model_service 0.1.0 10985e3d96bd 9 seconds ago 922MB
Next, we'll start the image to see if everything is working as expected.
!docker run -d \
    -p 8000:8000 \
    -e REST_CONFIG=./configuration/rest_configuration.yaml \
    -e NODE_IP="123.123.123.123" \
    -v $(pwd)/../configuration:/service/configuration \
    --name credit_risk_model_service \
    credit_risk_model_service:0.1.0
265c3f15cae7c9b9788f0c1c96c66dcf28e7bba7b48f002671dc674cf1982f19
Notice that we added an environment variable called NODE_IP, this is just so we have a value to pull into the logs later, its not the real node IP address.
The service is up and running in the docker container. To view the logs coming out of the process, we'll use the docker logs command:
!docker logs credit_risk_model_service
{"asctime": "2023-04-24 01:31:03,901", "node_ip": "123.123.123.123", "name": "rest_model_service.helpers", "levelname": "INFO", "message": "Creating FastAPI app for: 'Credit Risk Model Service'."}
INFO:     Started server process [1]
INFO:     Waiting for application startup.
INFO:     Application startup complete.
INFO:     Uvicorn running on http://0.0.0.0:8000 (Press CTRL+C to quit)
As we expected, the logs are coming out in JSON format, although there are some that are not. These logs are being emitted from logger objects that were initialized before the rest_model_service package got a chance to be initialized.
The service should be accessible on port 8000 of localhost, so we'll try to make a prediction using the curl command:
!curl -X 'POST' \
  'http://127.0.0.1:8000/api/models/credit_risk_model/prediction' \
  -H 'accept: application/json' \
  -H 'Content-Type: application/json' \
  -d '{ \
      "annual_income": 273000, \
      "collections_in_last_12_months": 20, \
      "delinquencies_in_last_2_years": 39, \
      "debt_to_income_ratio": 42.64, \
      "employment_length": "< 1 year", \
      "home_ownership": "MORTGAGE", \
      "number_of_delinquent_accounts": 6, \
      "interest_rate": 28.99, \
      "last_payment_amount": 36475.59, \
      "loan_amount": 35000, \
      "derogatory_public_record_count": 86, \
      "loan_purpose": "debt_consolidation", \
      "revolving_line_utilization_rate": 892.3, \
      "term": " 36 months", \
      "total_payments_to_date": 57777.58, \
      "verification_status": "Source Verified" \
}'
{"credit_risk":"safe"}
We're done with the docker container so we'll stop it and stop it and remove it.
!docker kill credit_risk_model_service
!docker rm credit_risk_model_service
credit_risk_model_service
credit_risk_model_service
Creating a Kubernetes Cluster
To show the system in action, we’ll deploy the model service and the minio service to a Kubernetes cluster. A local cluster can be easily started by using minikube. Installation instructions can be found here.
To start the minikube cluster execute this command:
!minikube start --memory 4196
😄 minikube v1.30.1 on Darwin 13.3.1
✨ Using the docker driver based on existing profile
👍 Starting control plane node minikube in cluster minikube
🚜 Pulling base image ...
🔄 Restarting existing docker container for "minikube" ...
🐳 Preparing Kubernetes v1.26.3 on Docker 23.0.2 ...[K[K[K[K[K[K[K[K[K[K[K[K[K[K[K[K[K[K[K[K[K[K[K[K[K[K[K[K[K[K[K[K[K[K[K[K[K[K[K[K[K[K[K[K[K[K[K[K[K[K[K[K[K[K[K[K[K[K[K[K[K[K[K[K[K[K[K[K[K[K[K[K[K[K[K[K[K[K[K[K[K[K[K[K[K[K[K[K[K[K[K[K[K[K[K[K[K[K[K[K[K[K[K[K[K[K[K[K[K[K[K[K[K[K[K[K[K[K[K[K[K[K[K[K[K[K[K[K[K[K[K[K[K[K[K[K[K[K[K[K[K[K[K[K[K[K[K[K[K[K[K[K[K[K[K[K[K[K[K[K[K[K[K[K[K[K[K[K[K[K[K[K[K[K[K[K[K[K[K[K[K[K[K[K[K[K[K[K[K[K[K[K[K[K[K[K[K[K[K[K[K[K[K[K[K[K[K[K[K[K[K[K[K[K[K[K[K[K[K[K[K[K[K[K[K[K[K[K[K[K[K[K[K[K[K[K[K[K[K[K[K[K[K[K[K[K[K[K[K[K[K[K[K[K[K[K[K[K[K[K[K[K[K[K[K[K[K[K[K[K[K[K[K[K[K[K[K[K[K[K[K[K[K[K[K[K[K[K[K[K[K[K[K[K[K[K[K[K[K[K[K[K[K[K[K[K[K[K[K[K[K[K[K[K[K[K[K[K[K[K[K[K[K[K[K[K[K[K[K[K[K[K[K[K[K[K[K[K[K[K[K[K[K[K[K[K[K[K[K[K[K[K[K[K[K[K[K[K[K[K[K[K[K[K[K[K[K[K[K[K[K[K[K[K[K[K[K[K[K[K
🔗 Configuring bridge CNI (Container Networking Interface) ...
🔎 Verifying Kubernetes components...
▪ Using image gcr.io/k8s-minikube/storage-provisioner:v5
▪ Using image docker.io/kubernetesui/dashboard:v2.7.0
▪ Using image docker.io/kubernetesui/metrics-scraper:v1.0.8
💡 Some dashboard features require the metrics-server addon. To enable all features please run:
minikube addons enable metrics-server
🌟 Enabled addons: storage-provisioner, default-storageclass, dashboard
🏄 Done! kubectl is now configured to use "minikube" cluster and "default" namespace by default
Let's view all of the pods running in the minikube cluster to make sure we can connect to it using the kubectl command.
!kubectl get pods -A
NAMESPACE              NAME                                        READY   STATUS    RESTARTS       AGE
kube-system            coredns-787d4945fb-48bzx                    1/1     Running   2 (3d5h ago)   4d23h
kube-system            etcd-minikube                               1/1     Running   2 (3d5h ago)   4d23h
kube-system            kube-apiserver-minikube                     1/1     Running   2 (3d5h ago)   4d23h
kube-system            kube-controller-manager-minikube            1/1     Running   2 (3d5h ago)   4d23h
kube-system            kube-proxy-jj4pz                            1/1     Running   2 (3d5h ago)   4d23h
kube-system            kube-scheduler-minikube                     1/1     Running   2 (3d5h ago)   4d23h
kube-system            storage-provisioner                         1/1     Running   6 (33s ago)    4d23h
kubernetes-dashboard   dashboard-metrics-scraper-5c6664855-fgpqq   1/1     Running   2 (3d5h ago)   4d23h
kubernetes-dashboard   kubernetes-dashboard-55c4cbbc7c-ddx2q       1/1     Running   4 (32s ago)    4d23h
Looks like we can connect, we're ready to start deploying the model service to the cluster.
Creating a Namespace
Now that we have a cluster and are connected to it, we'll create a namespace to hold the resources for our model deployment. The resource definition is in the kubernetes/namespace.yaml file. To apply the manifest to the cluster, execute this command:
!kubectl create -f ../kubernetes/namespace.yaml
namespace/model-services created
To take a look at the namespaces, execute this command:
!kubectl get namespace
NAME                   STATUS   AGE
default                Active   4d23h
kube-node-lease        Active   4d23h
kube-public            Active   4d23h
kube-system            Active   4d23h
kubernetes-dashboard   Active   4d23h
model-services         Active   1s
The new namespace should appear in the listing along with other namespaces created by default by the system.
Creating the Model Service
The model service is deployed by using Kubernetes resources. These are:
- ConfigMap: a set of configuration options, in this case it is a simple YAML file that will be loaded into the running container as a volume mount. This resource allows us to change the configuration of the model service without having to modify the Docker image.
- Deployment: a declarative way to manage a set of Pods, the model service pods are managed through the Deployment.
- Service: a way to expose a set of Pods in a Deployment, the model service is made available to the outside world through the Service.
These resources are defined in the kubernetes/model_service.yaml file, the file is long so we won't list it here. The env section in the container's definition in the Deployment has a special section which is allowing us to access information about the pod and the node:
...
- name: REST_CONFIG
  value: ./configuration/kubernetes_rest_config.yaml
- name: POD_NAME
  valueFrom:
    fieldRef:
      fieldPath: metadata.name
- name: NODE_NAME
  valueFrom:
    fieldRef:
      fieldPath: spec.nodeName
- name: APP_NAME
  valueFrom:
    fieldRef:
      fieldPath: metadata.labels['app']
...
The pod definition is using the downward API provided by Kubernetes to access the node name, the pod name, and the contents of the 'app' label. This information is made available as environment variables. We'll be adding this information to the log by adding the names of the environment variables to the logger configuration that we'll give to the model service. We built a logging context class above for the purpose of adding environment variables to log records.
We're almost ready to deploy the model service, but before starting it we'll need to send the docker image from the local docker daemon to the minikube image cache:
!minikube image load credit_risk_model_service:0.1.0
We can view the images in the minikube cache with this command:
!minikube image ls | grep credit_risk_model_service
docker.io/library/credit_risk_model_service:0.1.0
The model service will need to access the YAML configuration file that we used for the local service above. This is file is in the /configuration folder and is called "kubernetes_rest_config.yaml", its customized for the kubernetes environment we're building.
To create a ConfigMap for the service, execute this command:
!kubectl create configmap -n model-services model-service-configuration \
    --from-file=../configuration/kubernetes_rest_config.yaml
configmap/model-service-configuration created
The service is deployed to the Kubernetes cluster with this command:
!kubectl apply -n model-services -f ../kubernetes/model_service.yaml
deployment.apps/credit-risk-model-deployment created
service/credit-risk-model-service created
The deployment and service for the model service were created together. Lets view the Deployment to see if it is available yet:
!kubectl get deployments -n model-services
NAME                           READY   UP-TO-DATE   AVAILABLE   AGE
credit-risk-model-deployment   1/1     1            1           33s
You can also view the pods that are running the service:
!kubectl get pods -n model-services -l app=credit-risk-model-service
NAME                                           READY   STATUS    RESTARTS   AGE
credit-risk-model-deployment-554575f4f-5rl5s   1/1     Running   0          35s
The Kubernetes Service details look like this:
!kubectl get services -n model-services
NAME                        TYPE       CLUSTER-IP      EXTERNAL-IP   PORT(S)        AGE
credit-risk-model-service   NodePort   10.104.38.144   <none>        80:32268/TCP   37s
We'll run a proxy process locally to be able to access the model service endpoint:
minikube service credit-risk-model-service --url -n model-services
The command outputs this URL:
http://127.0.0.1:50222
We can send a request to the model service through the local endpoint like this:
!curl -X 'POST' \
  'http://127.0.0.1:50222/api/models/credit_risk_model/prediction' \
  -H 'accept: application/json' \
  -H 'Content-Type: application/json' \
  -d '{ \
      "annual_income": 273000, \
      "collections_in_last_12_months": 20, \
      "delinquencies_in_last_2_years": 39, \
      "debt_to_income_ratio": 42.64, \
      "employment_length": "< 1 year", \
      "home_ownership": "MORTGAGE", \
      "number_of_delinquent_accounts": 6, \
      "interest_rate": 28.99, \
      "last_payment_amount": 36475.59, \
      "loan_amount": 35000, \
      "derogatory_public_record_count": 86, \
      "loan_purpose": "debt_consolidation", \
      "revolving_line_utilization_rate": 892.3, \
      "term": " 36 months", \
      "total_payments_to_date": 57777.58, \
      "verification_status": "Source Verified" \
}'
{"credit_risk":"safe"}
The model is deployed within Kubernetes!
Accessing the Logs
Kubernetes has a built-in system that receives the stdout and stderr outputs of the running containers and saves them to the hard drive of the node for a limited time. You can view the logs emitted by the containers by using this command:
!kubectl logs -n model-services credit-risk-model-deployment-554575f4f-5rl5s -c credit-risk-model | grep "\"action\": \"predict\""
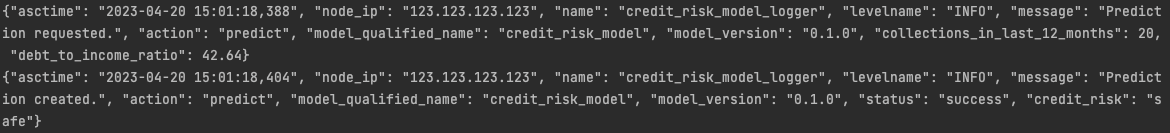
{"asctime": "2023-04-24 01:36:40,696", "pod_name": "credit-risk-model-deployment-554575f4f-5rl5s", "node_name": "minikube", "app_name": "credit-risk-model-service", "name": "credit_risk_model_logger", "levelname": "INFO", "message": "Prediction requested.", "action": "predict", "model_qualified_name": "credit_risk_model", "model_version": "0.1.0", "collections_in_last_12_months": 20, "debt_to_income_ratio": 42.64}
{"asctime": "2023-04-24 01:36:40,781", "pod_name": "credit-risk-model-deployment-554575f4f-5rl5s", "node_name": "minikube", "app_name": "credit-risk-model-service", "name": "credit_risk_model_logger", "levelname": "INFO", "message": "Prediction created.", "action": "predict", "model_qualified_name": "credit_risk_model", "model_version": "0.1.0", "status": "success", "credit_risk": "safe"}
The logs contain every field that we configured and they are in JSON format, as we expected. The log records also contain the pod_name, node_name, and app_name fields that we added through the downward API.
Although we can view the logs like this, this is not the ideal way to hold logs. We need to be able to search through the logs generated across the whole system. To do this we'll need to export the logs to an external logging system. We'll be working on that in another section of this blog post.
Creating the Logging System
The complexity of modern cloud environment makes it hard to manage logs in individual servers since we really don't know where our workloads are going to be scheduled ahead of time. Kubernetes workloads are highly distributed, meaning that an application can be replicated in many different nodes in a cluster. This makes it necessary to gather logs together in one place so that we can more easily view and analyze them.
A logging system is responsible for gathering log records from all of the instances of a running application and make them searchable from one centralized location. In this section, we'll add such a logging system to the cluster and use it to monitor the model service we've deployed.
We'll be installing the Elastic Cloud on Kubernetes operator in order to view our logs. The operator installs and manages ElasticSearch, Kibana, and Filebeat services.
To begin, lets install the custom resource definitions needed by the operator:
!kubectl create -f https://download.elastic.co/downloads/eck/2.7.0/crds.yaml
customresourcedefinition.apiextensions.k8s.io/agents.agent.k8s.elastic.co created
customresourcedefinition.apiextensions.k8s.io/apmservers.apm.k8s.elastic.co created
customresourcedefinition.apiextensions.k8s.io/beats.beat.k8s.elastic.co created
customresourcedefinition.apiextensions.k8s.io/elasticmapsservers.maps.k8s.elastic.co created
customresourcedefinition.apiextensions.k8s.io/elasticsearchautoscalers.autoscaling.k8s.elastic.co created
customresourcedefinition.apiextensions.k8s.io/elasticsearches.elasticsearch.k8s.elastic.co created
customresourcedefinition.apiextensions.k8s.io/enterprisesearches.enterprisesearch.k8s.elastic.co created
customresourcedefinition.apiextensions.k8s.io/kibanas.kibana.k8s.elastic.co created
customresourcedefinition.apiextensions.k8s.io/stackconfigpolicies.stackconfigpolicy.k8s.elastic.co created
We'll be using theses CRDs:
- elasticsearch.k8s.elastic.co, to deploy ElasticSearch for storing and indexing logs
- kibana.k8s.elastic.co, to deploy Kibana for viewing logs
- beat.k8s.elastic.co, to deploy Filebeat on each node to forward logs to ElasticSearch
The CRDs are used by the ECK operator to manage resources in the cluster. To install the ECK operator itself, execute this command:
!kubectl apply -f https://download.elastic.co/downloads/eck/2.7.0/operator.yaml
namespace/elastic-system created
serviceaccount/elastic-operator created
secret/elastic-webhook-server-cert created
configmap/elastic-operator created
clusterrole.rbac.authorization.k8s.io/elastic-operator created
clusterrole.rbac.authorization.k8s.io/elastic-operator-view created
clusterrole.rbac.authorization.k8s.io/elastic-operator-edit created
clusterrolebinding.rbac.authorization.k8s.io/elastic-operator created
service/elastic-webhook-server created
statefulset.apps/elastic-operator created
validatingwebhookconfiguration.admissionregistration.k8s.io/elastic-webhook.k8s.elastic.co created
ElasticSearch
We'll be storing logs in ElasticSearch. ElasticSearch is a distributed full-text search engine with a RESTful API. The ElasticSearch service is ideal for our needs because our logs are made up of text strings.
Now we're ready to install the service by applying the "ElasticSearch" custom resource definition:
apiVersion: elasticsearch.k8s.elastic.co/v1
kind: Elasticsearch
metadata:
  name: quickstart
spec:
  version: 8.7.0
  nodeSets:
  - name: default
    count: 1
    config:
      node.store.allow_mmap: false
The CRD is stored in the kubernetes/elastic_search.yaml file. The CRD is applied with this command:
!kubectl apply -n elastic-system -f ../kubernetes/elastic_search.yaml
elasticsearch.elasticsearch.k8s.elastic.co/quickstart created
To get a list of ElasticSearch clusters currently defined in the cluster, execute this comand:
!kubectl get elasticsearch -n elastic-system
NAME         HEALTH   NODES   VERSION   PHASE   AGE
quickstart   green    1       8.7.0     Ready   116s
We can look at the pods running the ElasticSearch cluster:
!kubectl get pods -n elastic-system --selector='elasticsearch.k8s.elastic.co/cluster-name=quickstart'
NAME                      READY   STATUS    RESTARTS   AGE
quickstart-es-default-0   1/1     Running   0          116s
A Kubernetes service is created to make the ElasticSearch service available to other services in the cluster:
!kubectl get service quickstart-es-http -n elastic-system
NAME                 TYPE        CLUSTER-IP      EXTERNAL-IP   PORT(S)    AGE
quickstart-es-http   ClusterIP   10.106.185.54   <none>        9200/TCP   2m2s
A user named "elastic" is automatically in the ElasticSearch services with the password stored in a Kubernetes secret. Let's access the password:
!kubectl get secret quickstart-es-elastic-user -n elastic-system -o=jsonpath='{.data.elastic}' | base64 --decode; echo
DD097Fe67Qs320Uw6JHIy2Vb
Kibana
To view the logs we'll be using Kibana. Kibana is a web application that can provide access to and visualize logs stored in ElasticSearch.
The CRD for Kibana looks like this:
apiVersion: kibana.k8s.elastic.co/v1
kind: Kibana
metadata:
  name: quickstart
spec:
  version: 8.7.0
  count: 1
  elasticsearchRef:
    name: quickstart
We'll apply the CRD with this command:
!kubectl apply -n elastic-system -f ../kubernetes/kibana.yaml
kibana.kibana.k8s.elastic.co/quickstart created
Similar to Elasticsearch, you can retrieve details about Kibana instances:
!kubectl get kibana -n elastic-system
NAME         HEALTH   NODES   VERSION   AGE
quickstart   green    1       8.7.0     51s
We can also view the associated Pods:
!kubectl get pod -n elastic-system --selector='kibana.k8s.elastic.co/name=quickstart'
NAME                             READY   STATUS    RESTARTS   AGE
quickstart-kb-589dc4f75b-ncpd7   1/1     Running   0          53s
A ClusterIP Service is automatically created for Kibana:
!kubectl get service quickstart-kb-http -n elastic-system
NAME                 TYPE        CLUSTER-IP      EXTERNAL-IP   PORT(S)    AGE
quickstart-kb-http   ClusterIP   10.111.166.26   <none>        5601/TCP   57s
We'll use kubectl port-forward to access Kibana from a local web browser:
kubectl port-forward service/quickstart-kb-http 5601 -n elastic-system
Now we can access the Kibana service from this URL:
http://localhost:5601
Open the URL in your browser to view the Kibana UI. Login as the "elastic" user. The password is the one we retrieved above.
Filebeat
In order to centralize access to logs, we'll first need a way to get the logs off of the individual cluster nodes and forward them to the aggregator service. The service we'll use to do this is called Filebeat. Filebeat is a lightweight service that can forward logs stored in files to an outside service. We'll deploy Filebeat as a DaemonSet to ensure there’s a running instance on each node of the cluster.
The Filebeat CRD looks like this:
apiVersion: beat.k8s.elastic.co/v1beta1
kind: Beat
metadata:
  name: quickstart
spec:
  type: filebeat
  version: 8.7.0
  elasticsearchRef:
    name: quickstart
  kibanaRef:
    name: quickstart
  config:
    processors:
      - decode_json_fields:
          fields: ["message"]
          max_depth: 3
          target: parsed_message
          add_error_key: false
    filebeat.inputs:
    - type: container
      paths:
      - /var/log/containers/*.log
  daemonSet:
    podTemplate:
      spec:
        dnsPolicy: ClusterFirstWithHostNet
        hostNetwork: true
        securityContext:
          runAsUser: 0
        containers:
        - name: filebeat
          volumeMounts:
          - name: varlogcontainers
            mountPath: /var/log/containers
          - name: varlogpods
            mountPath: /var/log/pods
          - name: varlibdockercontainers
            mountPath: /var/lib/docker/containers
        volumes:
        - name: varlogcontainers
          hostPath:
            path: /var/log/containers
        - name: varlogpods
          hostPath:
            path: /var/log/pods
        - name: varlibdockercontainers
          hostPath:
            path: /var/lib/docker/containers
The container logs host folder (/var/log/containers) is mounted on the Filebeat container. The filebeat process also has a processor defined:
- decode_json_fields, which decodes fields containing JSON strings and replaces the strings with valid JSON objects
Let's apply the CRD to create the Filebeat DaemonSet:
!kubectl apply -n elastic-system -f ../kubernetes/filebeat.yaml
beat.beat.k8s.elastic.co/quickstart created
Details about the Filebeat service can be viewed like this:
!kubectl get beat -n elastic-system
NAME         HEALTH   AVAILABLE   EXPECTED   TYPE       VERSION   AGE
quickstart   green    1           1          filebeat   8.7.0     35s
The pods running the service can be listed like this:
!kubectl get pods -n elastic-system --selector='beat.k8s.elastic.co/name=quickstart'
NAME                             READY   STATUS    RESTARTS   AGE
quickstart-beat-filebeat-znwsf   1/1     Running   0          38s
The Filebeat service is running on the single node in the cluster.
The logs are being forwarded to ElasticSearch and can be viewed in Kibana:
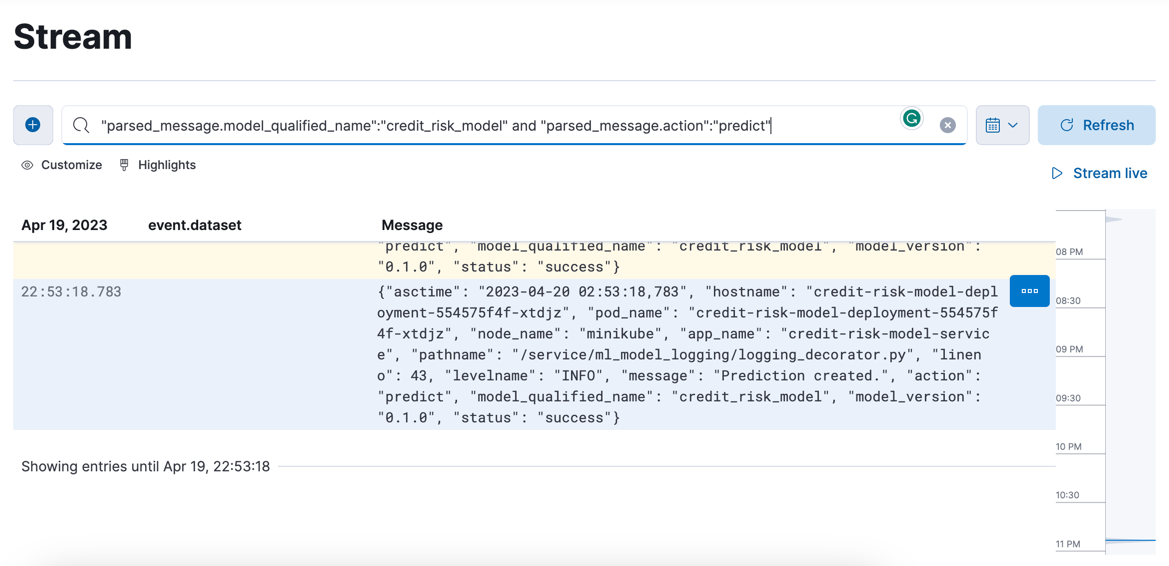
We have logs arriving from the model service and can view them in Kibana!
Deleting the Resources
To delete the Filebeat DaemonSet, execute this command:
!kubectl delete -n elastic-system -f ../kubernetes/filebeat.yaml
beat.beat.k8s.elastic.co "quickstart" deleted
To delete the Kibana service, execute this command:
!kubectl delete -n elastic-system -f ../kubernetes/kibana.yaml
kibana.kibana.k8s.elastic.co "quickstart" deleted
To delete the ElasticSearch service, execute this command:
!kubectl delete -n elastic-system -f ../kubernetes/elastic_search.yaml
elasticsearch.elasticsearch.k8s.elastic.co "quickstart" deleted
To remove all Elastic resources in all namespaces:
!kubectl get namespaces --no-headers -o custom-columns=:metadata.name | xargs -n1 kubectl delete elastic --all -n
No resources found
No resources found
No resources found
No resources found
No resources found
No resources found
No resources found
To uninstall the ECK operator:
!kubectl delete -f https://download.elastic.co/downloads/eck/2.7.0/operator.yaml
namespace "elastic-system" deleted
serviceaccount "elastic-operator" deleted
secret "elastic-webhook-server-cert" deleted
configmap "elastic-operator" deleted
clusterrole.rbac.authorization.k8s.io "elastic-operator" deleted
clusterrole.rbac.authorization.k8s.io "elastic-operator-view" deleted
clusterrole.rbac.authorization.k8s.io "elastic-operator-edit" deleted
clusterrolebinding.rbac.authorization.k8s.io "elastic-operator" deleted
service "elastic-webhook-server" deleted
statefulset.apps "elastic-operator" deleted
validatingwebhookconfiguration.admissionregistration.k8s.io "elastic-webhook.k8s.elastic.co" deleted
^C
To uninstall the Custom Resource Definitions for the ECK operator:
!kubectl delete -f https://download.elastic.co/downloads/eck/2.7.0/crds.yaml
customresourcedefinition.apiextensions.k8s.io "agents.agent.k8s.elastic.co" deleted
customresourcedefinition.apiextensions.k8s.io "apmservers.apm.k8s.elastic.co" deleted
customresourcedefinition.apiextensions.k8s.io "beats.beat.k8s.elastic.co" deleted
customresourcedefinition.apiextensions.k8s.io "elasticmapsservers.maps.k8s.elastic.co" deleted
customresourcedefinition.apiextensions.k8s.io "elasticsearchautoscalers.autoscaling.k8s.elastic.co" deleted
customresourcedefinition.apiextensions.k8s.io "elasticsearches.elasticsearch.k8s.elastic.co" deleted
customresourcedefinition.apiextensions.k8s.io "enterprisesearches.enterprisesearch.k8s.elastic.co" deleted
customresourcedefinition.apiextensions.k8s.io "kibanas.kibana.k8s.elastic.co" deleted
customresourcedefinition.apiextensions.k8s.io "stackconfigpolicies.stackconfigpolicy.k8s.elastic.co" deleted
To delete the model service kubernetes resources, we'll execute this command:
!kubectl delete -n model-services -f ../kubernetes/model_service.yaml
deployment.apps "credit-risk-model-deployment" deleted
service "credit-risk-model-service" deleted
We'll also delete the ConfigMap:
!kubectl delete -n model-services configmap model-service-configuration
configmap "model-service-configuration" deleted
Then the model service namespace:
!kubectl delete -f ../kubernetes/namespace.yaml
namespace "model-services" deleted
To shut down the minikube cluster:
!minikube stop
✋  Stopping node "minikube"  ...
🛑  Powering off "minikube" via SSH ...
🛑  1 node stopped.
Closing
In this blog post we showed how to do logging with the Python logging package, and how to create a decorator that can help us to do logging around an MLModel instance. We also set up and used a logging system within a Kubernetes cluster and used it to aggregate logs and view them. Logging is usually the first thing that is implemented when we need to monitor how a system performs, and machine learning models are no exception to this. The logging decorator allowed us to do complex logging without having to modify the implementation of the model at all, thus simplifying a common aspect of software observability.
One of the benefits of using the decorator pattern is that we are able to build up complex behaviors around an object. The LoggingDecorator class is very configurable, since we are able to configure it to log input and output fields from the model. This approach makes the implementation very flexible, since we do not need to modify the decorator's code to add fields to the log. The EnvironmentInfoFilter class that we implemented to grab information from the environment for logs is also built this way. We were able to get information about the Kubernetes deployment from the logs without having to modify the code.
The LoggingDecorator class is designed to work with MLModel classes, and this is the only hard requirement of the code. This makes the decorator very portable, because we are able to deploy it inside of any other model deployment service we may choose to build in the future. For example, we can just as easily decorate an MLModel instance running inside of an gRPC service, since the decorator would work exactly the same way. This is due to interface-driven approach that we took when designing the MLModel interface.
We added logging to the ML model instance from the "outside" and we were not able to access information about the internals of the model. This is a limitation of the decorator approach to logging which only has access to the model inputs, model outputs, and exceptions raised by the model. This approach is best used to add logging functionality to an ML model implementation that we do not control, or in simple situations in which the limitations of the approach do not affect us. If any logging of internal model state is needed, we'll need to generate logs from within the MLModel class.